
Drone Wind Resistance Levels Explained: How Much Wind Can a Drone Handle?

In outdoor commercial drone (UAV) operations, complex meteorological conditions are often the critical factor determining whether a project can be successfully and safely deployed. Among these, wind resistance is a core indicator for measuring whether an industrial drone can maintain stable hovering, precise data collection, and safe return to home (RTH) in harsh environments.
For engineering supervisors and procurement managers in fields such as photovoltaic (PV) inspections, high-rise exterior wall maintenance, offshore wind farm operations, and LiDAR mapping, merely relying on manufacturers’ promotional claims of “strong wind resistance” is far from enough.
Gaining a deep understanding of the international standards for drone wind resistance levels, the underlying technical logic governing wind resistance, and the operational limitations in strong winds is an essential course of action to prevent costly drone crashes and ensure data accuracy.
Table of Contents
What is a Drone Wind Resistance Level?
The wind resistance levels specified in the drone industry primarily reference the universally accepted Beaufort Wind Scale. Higher wind levels correspond to greater wind speeds and wind pressures, posing increasingly severe challenges to the drone’s power system, aerodynamic design, and flight control algorithms.
The table below outlines the correlation between common industrial drone wind resistance ratings, physical wind speed parameters, wind pressure ranges, and typical aircraft types:
| Wind Resistance Level (Level) | Beaufort Scale | Max Tolerable Wind Speed (m/s) | Max Tolerable Wind Speed (km/h) | Theoretical Wind Pressure (Pa, approx.) | Typical Drone Types and Applications |
| Level 4 | Level 4 (Gentle Breeze) | 5.5 – 7.9 m/s | 20 – 28 km/h | 18 – 38 Pa | Lightweight consumer drones, entry-level aerial photography drones |
| Level 5 | Level 5 (Fresh Breeze) | 8.0 – 10.7 m/s | 29 – 38 km/h | 39 – 70 Pa | Advanced consumer drones, light commercial mapping drones |
| Level 6 | Level 6 (Strong Breeze) | 10.8 – 13.8 m/s | 39 – 49 km/h | 71 – 116 Pa | Standard industrial drones (PV inspection, security monitoring) |
| Level 7 | Level 7 (Near Gale) | 13.9 – 17.1 m/s | 50 – 61 km/h | 117 – 179 Pa | Heavy-duty industrial drones, maritime inspection, specialized cleaning equipment |
| Level 8 | Level 8 (Gale) | 17.2 – 20.7 m/s | 62 – 74 km/h | 180 – 262 Pa | Polar/marine-grade special industrial UAVs, heavy-payload logistics drones |
Physical Formula Explanation: Air resistance/wind pressure Fdis proportional to the square of the wind speed (Fᵈ = ½ρv²ACᵈ, where ρ is air density, v is wind speed, A is frontal area, and Cd is the drag coefficient). This means that when wind speed increases from Level 5 (10 m/s) to Level 7 (15 m/s)—a wind speed increase of only 50%—the wind pressure and resistance experienced by the drone body skyrocket by 125%.
How Much Wind Can a Drone Actually Withstand?
Many buyers often fall into a misconception: “Does an advertised wind resistance of Level 6 mean everything is foolproof as long as wind speeds stay within Level 6?”
The answer is no. Official wind resistance ratings are typically tested under laboratory or wind tunnel limits with no payload, at standard sea-level atmospheric pressure, in open plains, and under single-direction wind conditions. In real-world engineering fields, conditions are far more complex:
Gusts vs. Sustained Winds
“Average wind speed” mentioned in weather reports is an average value during the time period considered (for example, 10 minutes). Over plain regions, a gust is generally 1.3 to 1.5 times more than average wind speed. On the other hand, where there is a complicated mountainous terrain or tall buildings, gust may even go above 2.0. With an average of 10m/s (Level 5) wind speed, it can attain a maximum value of 18m/s (Level 8) instantly in the form of a gust.
Disruption of Payload to CoG
Since drones come equipped with high precision 3-axis gimbals, LiDAR sensors, or even water-washing sprayers, they have to cope with a three-pronged problem of an increased frontal area (A), leading to greater wind resistance, a new Center of Gravity (CoG) causing an imbalance in static loads on motors, and moment of inertia. Measured Effect: When fully loaded with equipment, a drone’s actual wind resistance capacity typically drops by 1 to 2 levels compared to its nominal value.
Atmospheric Pressure and Altitude Thrust Suppression
In plateau or high-temperature environments, air density (ρ) decreases, leading to a reduction in thrust generated by motor propellers. A drone rated for Level 7 wind resistance at sea level may see its thrust reserve drop by 15% to 20% when operating at an altitude of 3,000 meters, effectively degrading its actual wind resistance to Level 6.
Wind Resistance Rating vs. Max Flight Speed vs. Gust Resistance
Considering the analysis of drones’ datasheets, it is important to clearly define the three key terms mentioned above:
Wind Resistance Rating
Maximum wind speed which allows a drone to hover steadily and have an ability to control its attitude (with Roll/Pitch angle maintained within acceptable values).
Maximum flight speed:
The maximum speed of a drone in still air.
Headwind thrust calculation formula: Actual Ground Speed = Max Flight Speed – Headwind Speed.
Situation Risk: given that the maximum speed of a drone is 15 m/s, the presence of headwind with the speed of 15 m/s will result in actual ground speed of 0 m/s (at full throttle, the drone hovers on the spot without any possibility of moving in any direction).
Gust Handling:
The ability and promptness of the flight control system to react to the change in wind direction within milliseconds and employ the energy reserve for correcting the drone’s attitude.
4 Core Technical Factors Determining Drone Wind Resistance
A drone’s wind resistance performance cannot be solved simply by “adding weight to the airframe”; it is the result of synergy among the power system, aerodynamic shape, and control algorithms:
Thrust-to-Weight Ratio (T/W):
This is the single most critical metric determining wind resistance. Typically, commercial drones have a T/W ratio of 2:1, while industrial drones have a T/W ratio of 3:1 or even higher at 4:1. High T/W ratio means that the motors have enough spare power, which enables them to increase the speed of motor rotations to compensate for gusts within a matter of milliseconds.
Aerodynamic Design and Drag Coefficient:
Streamlined airframes, elliptical or slender arms effectively minimize the frontal surface area. A lower drag coefficient results in less turbulence and side-detachment vortices generated on the airframe surface by strong winds, making the aircraft attitude less prone to shaking.
Flight Control Algorithms and Sensor Response (IMU & RTK):
Commercial-grade IMUs have sampling rates greater than 1,000 Hz to detect changes in attitude on a millisecond scale. The flight controller utilizes adaptive PID/feed forward control algorithms that determine motor speed differences in real-time, while the RTK dual antenna provides heading orientation on a centimeter scale.
High-Rigidity Materials and Propeller/Frame Rigidity:
Most industrial drones use high modulus carbon fiber propellers and unibody carbon fiber frames. Plastics that are soft will easily deform under high thrust resistance from the wind, resulting in loss of lift capability and resonance problems, while the carbon fiber material will not.
Specific Impacts of Strong Winds on Various Industrial Application Scenarios
In different industrial operations, strong winds introduce not only “safety risks” but also directly compromise data quality and operational efficiency:
High-Rise Maintenance and Exterior Wall Cleaning:
High-rise building clusters easily create the Venturi effect, causing local wind speeds to be 50% to 100% higher than in open ground, accompanied by severe detached winds and up/down draft currents. Strong winds can cause high-pressure cleaning spray guns or painting equipment to deviate from flight paths, resulting in uneven cleaning, or cause the drone to crash into curtain wall glass due to attitude loss of control.
Inspection of Solar Photovoltaic and Offshore Wind Farms:
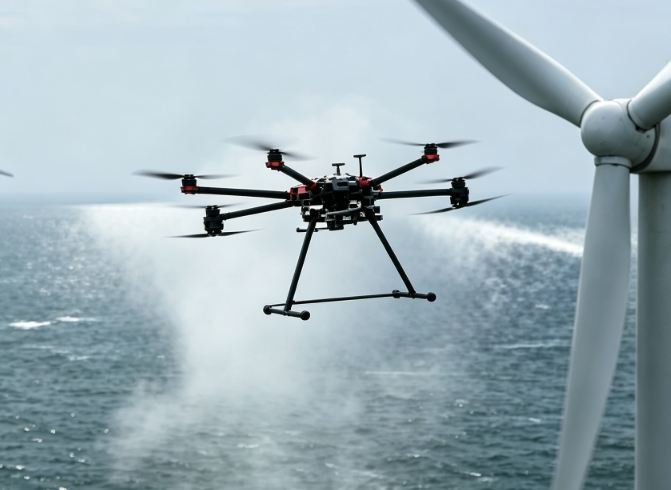
Offshore wind farms have no obstacles in their way; sea winds are constant and gusty, having high salt fog and humidity in their air currents. The winds create high-frequency vibrations in the air frame and gimbals. Using high magnification in optical zoom or thermal imaging leads to motion blur/defocus in hot spot defects’ images, which directly impacts the performance of AI-based defect detection.
LiDAR Mapping and High-Precision 3D Modeling:
Mapping operations typically require high-altitude grid flight. Frequent, violent adjustments of attitude angles (Pitch/Roll) in strong winds induce stitching drift and increased noise in LiDAR point cloud data, distorting digital elevation models (DEM) and elevation data.
How to Choose the Right Industrial Drone for Strong Wind Environments?
When procuring drones for high-wind operations, it is recommended to focus on the following parameter combinations and hardware selection indicators:
Basic Performance Metrics
Prioritize equipment with a nominal wind resistance rating of Level 6 (10.8 m/s) or Level 7 (13.9 m/s) and above; pay attention to the “maximum gust resistance speed” in the datasheet.
Ingress Protection (IP) Rating
Wind usually comes along with dust or moisture, or salt mists; an IP54 or an IP55 (or higher rating) enclosed airframe is more appropriate.
RTK Dual Antenna System
Conventional compasses are sensitive to interference from strong magnetic fields or metals in industrial areas; the dual antenna RTK system helps to prevent heading error induced by strong wind.
Motor Redundancy Architecture
For high-risk critical engineering tasks, select multi-rotor platforms with six or eight axes. If a motor or propeller fails under full-load wind resistance conditions, the flight controller can switch to heterogeneous power control modes for safe emergency landing.
Practical Safety Flight Protocols in Strong Wind Environments
Even with industrial drones boasting the highest wind resistance ratings, pilots in the field must strictly adhere to the following SOP operational safety guidelines:
Monitor High-Altitude Gusts, Not Just Ground Average Wind Speeds
Ground anemometers cannot reflect real wind fields at 100 meters altitude. Combine handheld anemometers, high-altitude meteorological forecasts, or motor load rates during drone hovering to make judgments. If high-altitude gusts reach 80% of the equipment’s nominal limit, suspend flight immediately.
Increase the Low-Battery Return-to-Home (RTH) Margin:
A drone’s battery consumption rate during a headwind return flight can be 2 to 3 times higher than in calm conditions. For strong wind operations, it is recommended to raise the low-battery alarm threshold from the standard 25% to 35%–40%.
Route “Crosswind / Tailwind”
While designing an automated route, one may attempt to direct the route towards the direction of the tailwind; if there is no choice but to fly into a headwind, one should employ low altitude flying technique (since wind speed at low altitudes is lower) or use a zigzag route strategy.
Conclusion
The understanding of the wind resistance rating of drones is more than just looking at a figure that is indicated in a data sheet; it is fundamental in the assessment of engineering safety, efficiency, and data integrity.
With an understanding of the wind conditions at the site of the project, and through a comprehensive consideration of the ratio of thrust to weight, aerodynamics, flight control algorithm, and load matching, one can always choose appropriate industrial drones with enough power storage and advanced control systems.